Μέταλλα, απολύτως απαραίτητα υλικά για την διαβίωσή μας!
Σύμφωνα με το British Geological Survey, ο κόσμος μας καταναλώνει 100,6 δισεκατομμύρια τόνους υλικών ετησίως. Από αυτό το σύνολο, 3,2 δισεκατομμύρια τόνοι είναι μέταλλα και αντιστοιχούν μολις μόλις στο 3% της συνολικής κατανάλωσης υλικών.Η εξορυκτική/μεταλλουργική βιομηχανία παράγει περίπου 3 δισ. τόνους σιδηρομεταλλεύματος, που αντιπροσωπεύουν σχεδόν το 94% όλων των παραγόμενων μετάλλων. Η κύρια χρήση όλου αυτού του σιδήρου (98%) είναι η κατασκευή χάλυβα. Τα βιομηχανικά και τεχνολογικά μέταλλα αποτελούν το υπόλοιπο 6% όλων των μετάλλων.Δεν αποτελεί έκπληξη το γεγονός ότι το αλουμίνιο είναι το πιο παραγόμενο βιομηχανικό μέταλλο. Το ελαφρύ μέταλλο είναι ένα από τα πιο συχνά χρησιμοποιούμενα υλικά στον κόσμο, με χρήσεις που κυμαίνονται από την κατασκευή φύλλων και δοχείων μπύρας/αναψυκτικών μέχρι κτηρίων και εξαρτημάτων αεροσκαφών. Το μαγγάνιο και το χρώμιο κατατάσσονται στη δεύτερη και τρίτη θέση αντίστοιχα και είναι σημαντικά πρόσθετα συστατικά στη χαλυβουργία. Το μαγγάνιο βοηθά στη μετατροπή του σιδηρομεταλλεύματος σε χάλυβα και το χρώμιο σκληραίνει τον χάλυβα. Επιπλέον, το μαγγάνιο είναι ένα κρίσιμο συστατικό των μπαταριών λιθίου-μαγγανίου-οξειδίου του κοβαλτίου (NMC) για ηλεκτρικά οχήματα. Αν και η παραγωγή χαλκού είναι περίπου το ένα τρίτο από αυτήν του αλουμινίου, ο χαλκός διαδραματίζει βασικό ρόλο στο να κάνει δυνατή τη σύγχρονη διαβίωση. Το μέταλλο αυτό βρίσκεται σχεδόν σε κάθε καλώδιο, κινητήρα και ηλεκτρική συσκευή στα σπίτια και τα γραφεία μας. Είναι επίσης κρίσιμο για διάφορες τεχνολογίες ανανεώσιμων πηγών ενέργειας και ηλεκτρικών οχημάτων.Είναι επίσης ενδιαφέρον να δούμε την και τα μέταλλα που χρειάζονται για την ενεργειακή μετάβαση. Το λίθιο, το κοβάλτιο, το βανάδιο και το μολυβδαίνιο είναι όλα κρίσιμα για διάφορες ενεργειακές τεχνολογίες, συμπεριλαμβανομένων των μπαταριών ιόντων λιθίου, των αιολικών πάρκων και των τεχνολογιών αποθήκευσης ενέργειας. Επιπλέον, η εξορυκτική βιομηχανία παράγει ετησίως περίπου 220.000 τόνους στοιχείων σπάνιων γαιών, εκ των οποίων 60% προέρχονται από την Κίνα. Τέλος, δεδομένης της σπανιότητάς τους, δεν προκαλεί έκπληξη το γεγονός ότι τα μέταλλα της ομάδας του χρυσού, του ασημιού και της πλατίνας (PGMs) ήταν τα λιγότερο παραγόμενα υλικά σε αυτήν την κατηγορία. Συλλογικά, αυτά τα μέταλλα αντιπροσωπεύουν μόλις το 2,3% της συνολικής παραγόμενης ποσότητας μετάλλων.
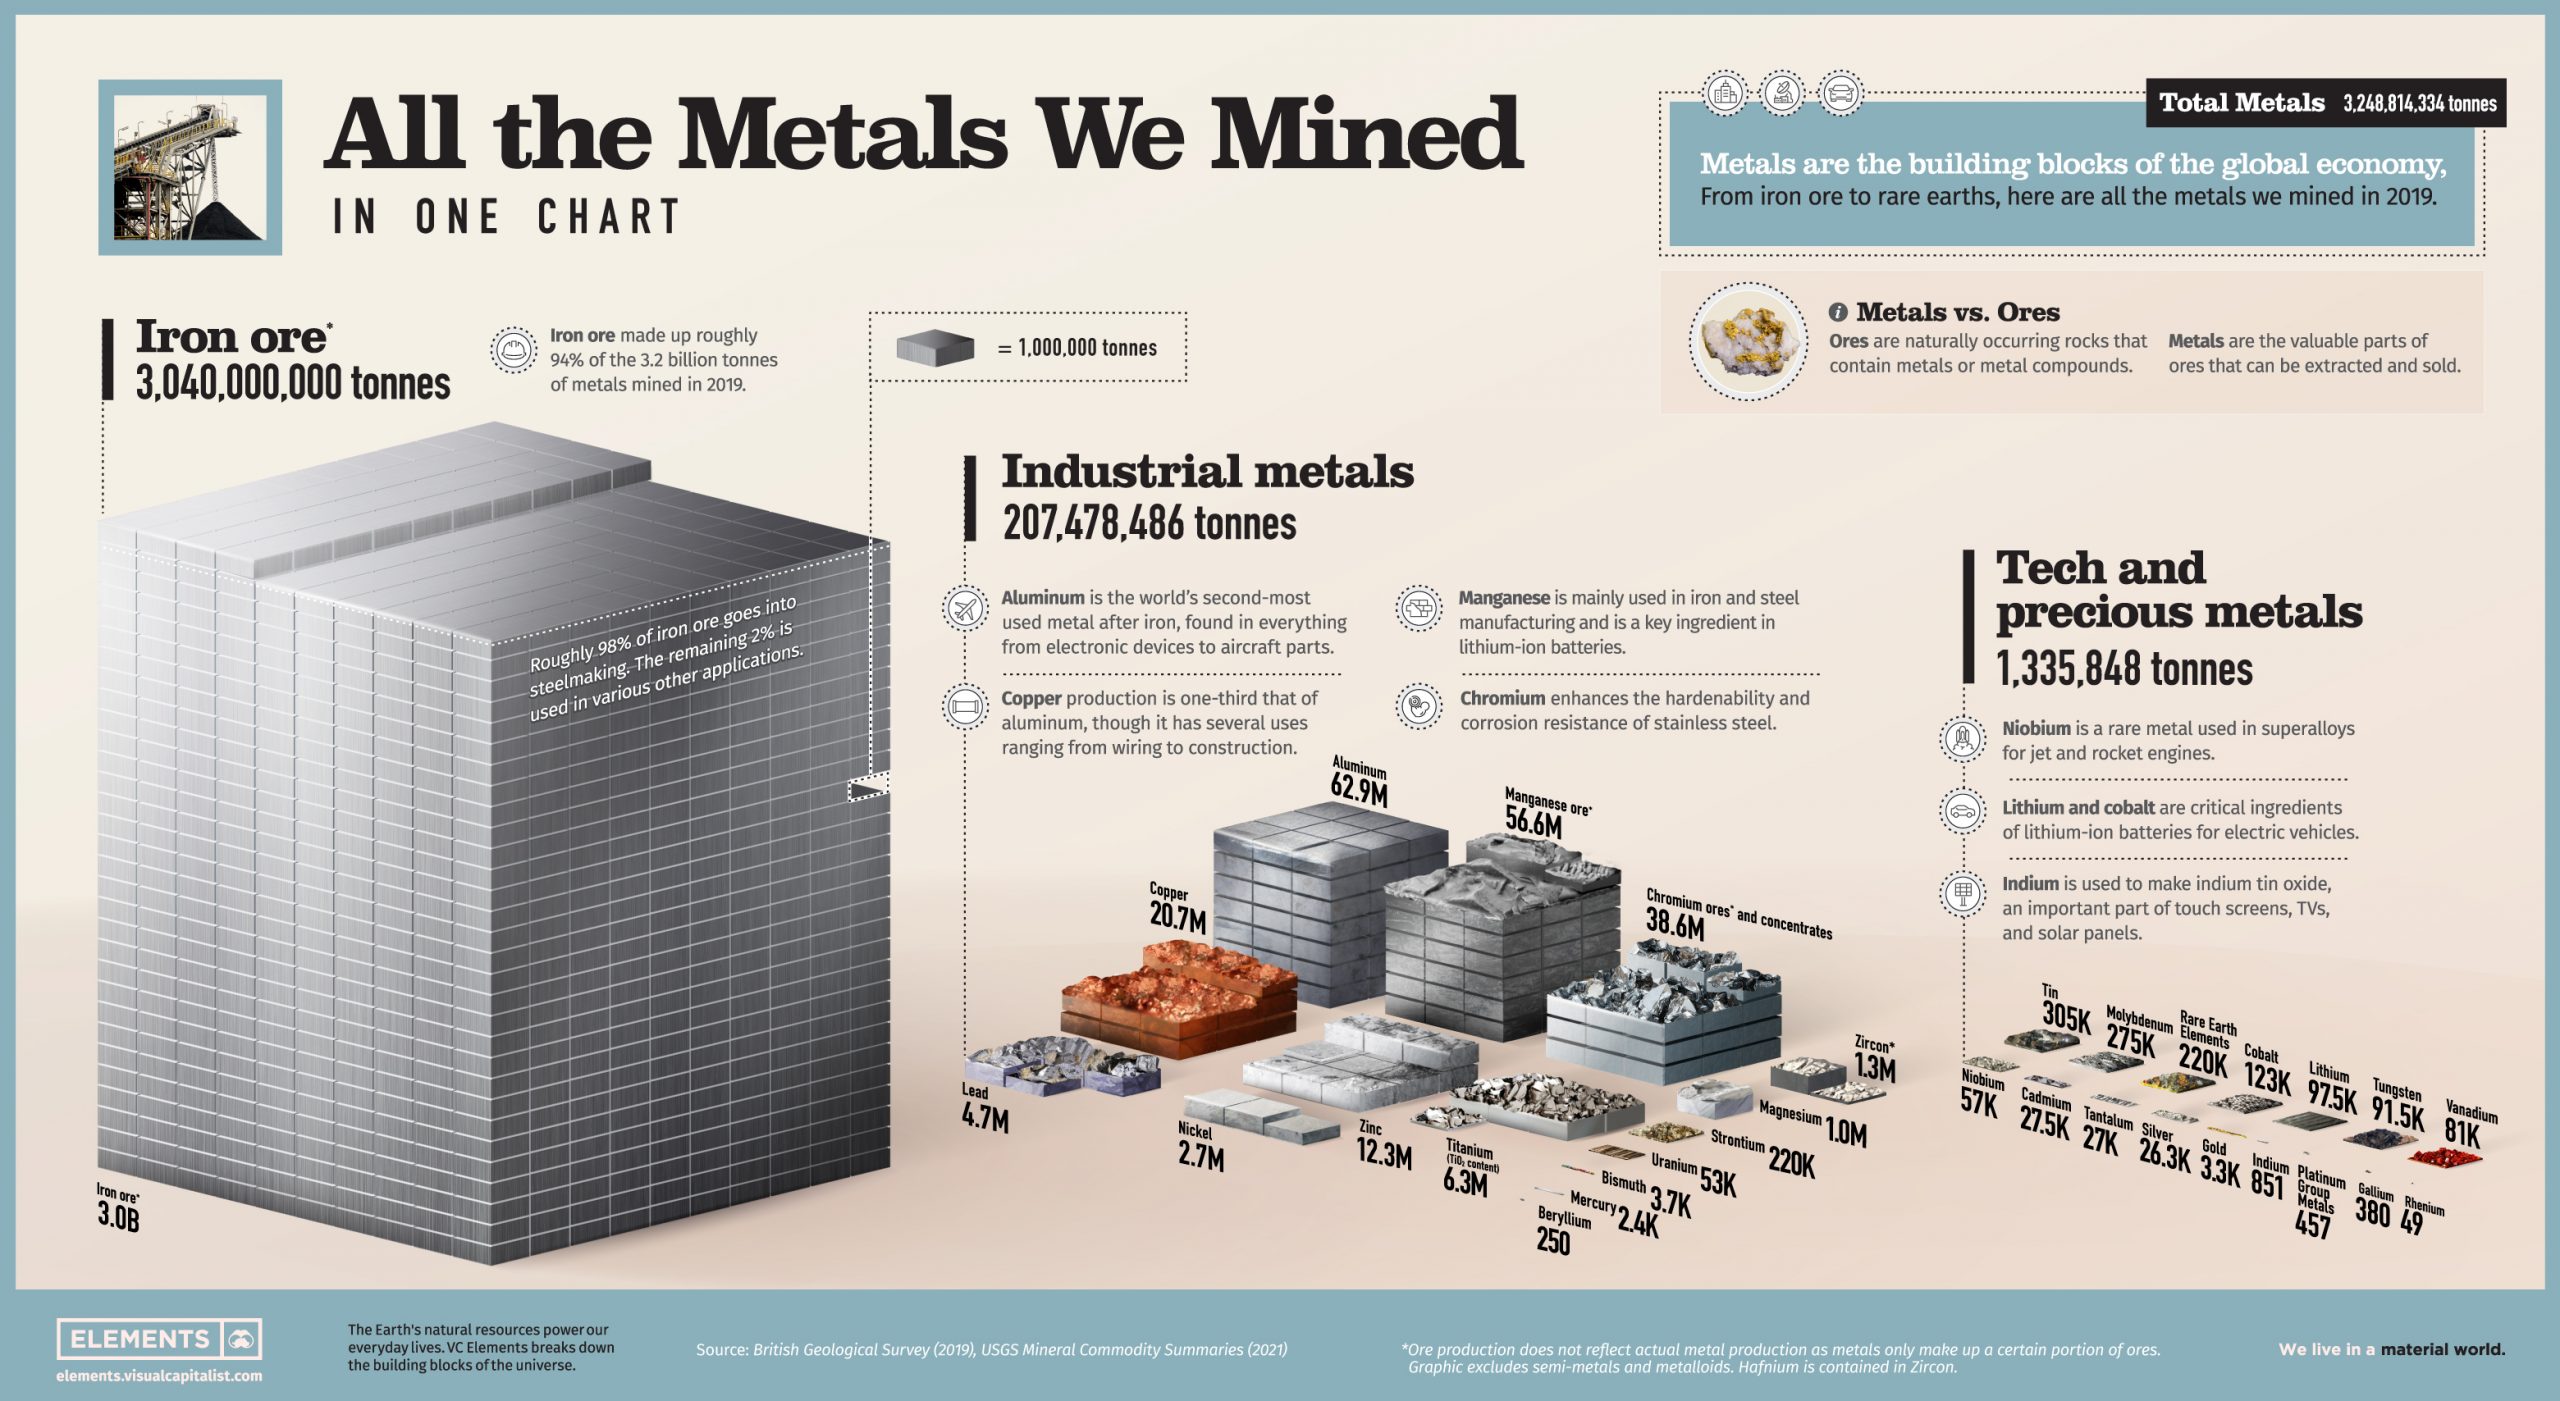
All the Metals We Mined in One Visualization
Metals are all around us, from our phones and cars to our homes and office buildings.
While we often overlook the presence of these raw materials, they are an essential part of the modern economy. But obtaining these materials can be a complex process that involves mining, refining, and then converting them into usable forms.
So, how much metal gets mined in a year?
Metals vs Ores
Before digging into the numbers, it’s important that we distinguish between ores and metals.
Ores are naturally occurring rocks that contain metals and metal compounds. Metals are the valuable parts of ores that can be extracted by separating and removing the waste rock. As a result, ore production is typically much higher than the actual metal content of the ore. For example, miners produced 347 million tonnes of bauxite ore in 2019, but the actual aluminum metal content extracted from that was only 62.9 million tonnes.
Here are all the metals and metal ores mined in 2019, according to the British Geological Survey:
| Metal/Ore | Quantity Mined (tonnes) | % of Total |
|---|---|---|
| Iron Ore | 3,040,000,000 | 93.57% |
| Industrial Metals | 207,478,486 | 6.39% |
| Technology and Precious Metals | 1,335,848 | 0.04% |
| Total | 3,248,814,334 | 100% |
| Metal | Quantity Mined (tonnes) | % of Total |
|---|---|---|
| Strontium | 220,000 | 0.11% |
| Uranium | 53,400 | 0.03% |
| Bismuth | 3,700 | 0.002% |
| Mercury | 2,400 | 0.001% |
| Beryllium | 250 | 0.0001% |
| Total | 207,478,486 | 100% |
Miners produced roughly three billion tonnes of iron ore in 2019, representing close to 94% of all mined metals. The primary use of all this iron is to make steel. In fact, 98% of iron ore goes into steelmaking, with the rest fulfilling various other applications.
Industrial and technology metals made up the other 6% of all mined metals in 2019. How do they break down?
Industrial Metals
From construction and agriculture to manufacturing and transportation, virtually every industry harnesses the properties of metals in different ways.
Here are the industrial metals we mined in 2019.
| Metal | Quantity Mined (tonnes) | % of Total |
|---|---|---|
| Aluminum | 62,900,000 | 30% |
| Manganese Ore | 56,600,000 | 27% |
| Chromium Ores and Concentrates | 38,600,000 | 19% |
| Copper | 20,700,000 | 10% |
| Zinc | 12,300,000 | 6% |
| Titanium (Titanium Dioxide Content) | 6,300,000 | 3% |
| Lead | 4,700,000 | 2% |
| Nickel | 2,702,000 | 1% |
| Zirconium Minerals (Zircon) | 1,337,000 | 1% |
| Magnesium | 1,059,736 | 1% |
| Total | 207,478,486 | 100% |
| Metal | Quantity Mined (tonnes) | % of Total |
|---|---|---|
| Strontium | 220,000 | 0.11% |
| Uranium | 53,400 | 0.03% |
| Bismuth | 3,700 | 0.002% |
| Mercury | 2,400 | 0.001% |
| Beryllium | 250 | 0.0001% |
| Total | 207,478,486 | 100% |
Percentages may not add up to 100 due to rounding.
It’s no surprise that aluminum is the most-produced industrial metal. The lightweight metal is one of the most commonly used materials in the world, with uses ranging from making foils and beer kegs to buildings and aircraft parts.
Manganese and chromium rank second and third respectively in terms of metal mined, and are important ingredients in steelmaking. Manganese helps convert iron ore into steel, and chromium hardens and toughens steel. Furthermore, manganese is a critical ingredient of lithium-manganese-cobalt-oxide (NMC) batteries for electric vehicles.
Although copper production is around one-third that of aluminum, copper has a key role in making modern life possible. The red metal is found in virtually every wire, motor, and electrical appliance in our homes and offices. It’s also critical for various renewable energy technologies and electric vehicles.
Technology and Precious Metals
Technology is only as good as the materials that make it.
Technology metals can be classified as relatively rare metals commonly used in technology and devices. While miners produce some tech and precious metals in large quantities, others are relatively scarce.
| Metal | Quantity Mined in 2019 (tonnes) | % of Total |
|---|---|---|
| Tin | 305,000 | 23% |
| Molybdenum | 275,000 | 21% |
| Rare Earth Elements | 220,000 | 16% |
| Cobalt | 123,000 | 9% |
| Lithium | 97,500 | 7% |
| Tungsten | 91,500 | 7% |
| Vanadium | 81,000 | 6% |
| Niobium | 57,000 | 4% |
| Cadmium | 27,500 | 2% |
| Tantalum | 27,000 | 2% |
| Total | 1,335,848 | 100.00% |
| Metal | Quantity Mined in 2019 (tonnes) | % of Total |
|---|---|---|
| Silver | 26,261 | 2% |
| Gold | 3,350 | 0.3% |
| Indium | 851 | 0.06% |
| Platinum Group Metals | 457 | 0.03% |
| Gallium | 380 | 0.03% |
| Rhenium | 49 | 0.004% |
| Total | 1,335,848 | 100.00% |
Tin was the most-mined tech metal in 2019, and according to the International Tin Association, nearly half of it went into soldering.
It’s also interesting to see the prevalence of battery and energy metals. Lithium, cobalt, vanadium, and molybdenum are all critical for various energy technologies, including lithium-ion batteries, wind farms, and energy storage technologies. Additionally, miners also extracted 220,000 tonnes of rare earth elements, of which 60% came from China.
Given their rarity, it’s not surprising that gold, silver, and platinum group metals (PGMs) were the least-mined materials in this category. Collectively, these metals represent just 2.3% of the tech and precious metals mined in 2019.
A Material World
Although humans mine and use massive quantities of metals every year, it’s important to put these figures into perspective.
According to Circle Economy, the world consumes 100.6 billion tonnes of materials annually. Of this total, 3.2 billion tonnes of metals produced in 2019 would account for just 3% of our overall material consumption. In fact, the world’s annual production of cement alone is around 4.1 billion tonnes, dwarfing total metal production.
The world’s appetite for materials is growing with its population. As resource-intensive megatrends such as urbanization and electrification pick up the pace, our material pie will only get larger.
(Source: elements.visualcapitalist.com)